What usage DATA can Imagen capture?
What the Event Service looks like:
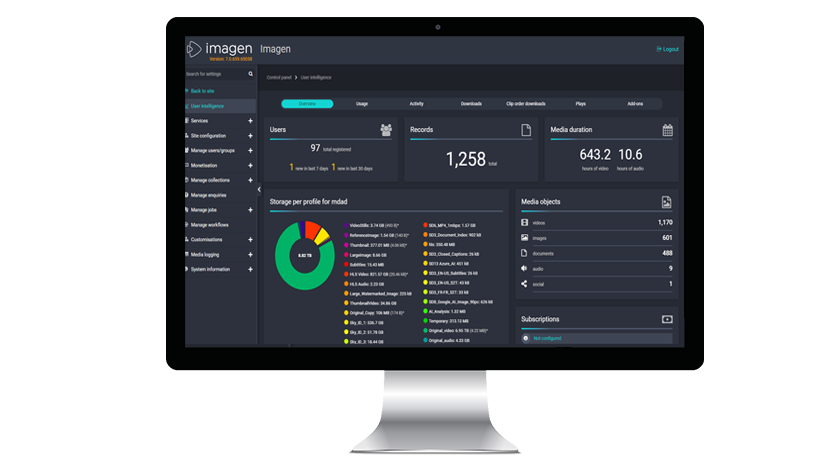
Overview
User interaction DATA is key to understanding how your platform is being used. Imagen offers a way to visualize user interaction DATA in a matter of seconds.
We have switched our data source for usage analytics from Google Analytics (GA) to Imagen’s Event Service data. The event services data has feature parity, plus we’ve added a couple of new graphsWhat usage DATA can Imagen capture?
Usage analytics diagrams that are shown in the management interface are provided by the Imagen Event Service. The event service provides:
- Overview
- User interaction
- Total number of users registered
- Number of new users in the past 7 days
- Number of new users in the past 30 days
- Records
-
- Total number of records on your platform
- Pie chart showing a breakdown of assets being stored
-
- Breakdown of assets by file type
- User interaction
- List of user subscriptions
- Usage
- Number of jobs run by each transcoder plugin
- Number of hours of each transcoder used
- Activity
- Number of user log-in sessions over time
- Most active users
- Popular search terms
- Logins by each organisation(if used)
- Downloads
- Number of Downloads over time - with download method as an optional filter
- Top number of downloads, by record from which they are downloaded
- Top downloaders, by user
- Top download method (AFD or Standard downloads for example)
- Clip Order Downloads
- Plays
- Add-ons
What the Event Service looks like:
💡Pro Tip: Although we believe in the tools for insight in our event service, It is still possible to use Google Analytics (GA)